House Sparrow
Passer domesticus
ABR description
The following is extracted from the Annual Bird Report for the twelve months to June 2017.
Common, breeding resident
Introduced species of urban and semi-urban areas.
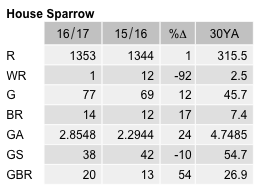
General: There was an increase in the number of records from last year (45%) and a 255% increase over 10 YA and a 393% increase in the 30YA. Records from a few more grid cells (10%) and all weeks. Reporting rate of 11.5%, almost exactly the 30YA. While there were some dips in the reporting rate – dropping below 10% in the period 1985 to 1989, and again between 2002 to 2009 – in the last 6 years the reporting rate has held steady at the current level. This contrasts with the abundance and reporting rate for the GBS survey (see below). The total number of birds reported continues to rise: 6812 this year is up 84% on last year and up 470% of 10YA and 779% on the 30YA. Max 60/5 Dec JWNR (GrB1), mean 5.2, median 3. Only 12 breeding records in 12 grids: earliest on/5 Sep (in Fairy Martin nests) Nelangelo TSR 48 (LeM1) and last cf/13 Jan Bibaringa (SmA1).
GBS: Decrease from last year with the abundance (A=2.2944) is at its lowest levels ever in the survey. In 1983 and 1986 the A value was above 8.0 and since then there has been an ever so gradual, almost constant, decline down to the present value A=2.2944. Average group size down to 7.7 from 9.4 last year, median 4, max 74/3wk Feb Jerrabomberra (HaL2). 13 breeding records from 4 sites (down from 39 records and 8 sites) commencing with nb/4wk Sep and concluding with nb/3wk Dec both at Crace GrK11 (LeF1).
Abundance
Abundance is the average number of birds of that species per survey. Where the species was observed (presence recorded) but the number of birds seen was not recorded, this is treated as a count of zero.
Abundance by year
This chart shows the abundance of House Sparrow between 1982 and 2017. 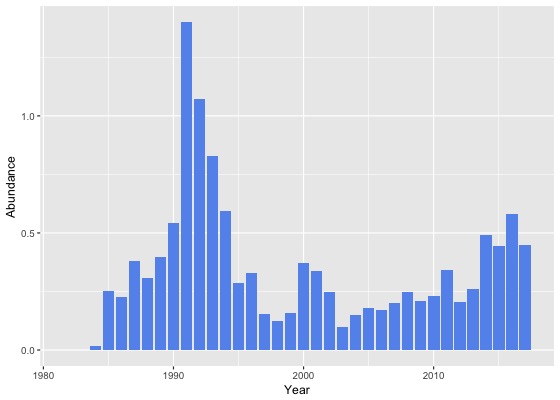
Abundance by month
This chart shows the monthly abundance of House Sparrow. The blue lines show the abundance for the twelve months to June 2017 and the bars show the average abundance for the period 1982 to 2017. 
Abundance by season
This chart shows the seasonal abundance of House Sparrow. The blue lines show the seasonal abundance for the twelve months to June 2017 and the bars show the average seasonal abundance for the period 1982 to 2017. 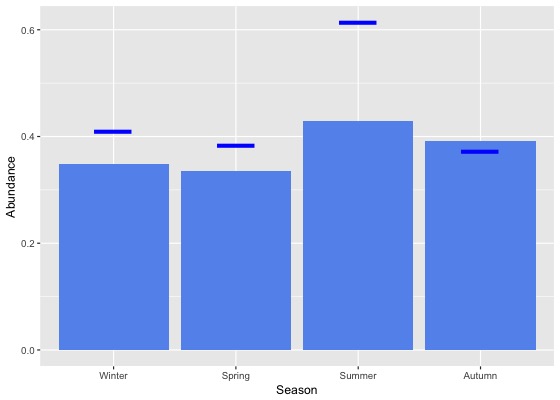
Abundance data
| Month | Season | ||||||||||||||||||
|---|---|---|---|---|---|---|---|---|---|---|---|---|---|---|---|---|---|---|---|
| Period | Jul | Aug | Sep | Oct | Nov | Dec | Jan | Feb | Mar | Apr | May | Jun | Winter | Spring | Summer | Autumn | All | ||
| All years | |||||||||||||||||||
| All | 0.4 | 0.3 | 0.3 | 0.4 | 0.4 | 0.3 | 0.4 | 0.5 | 0.3 | 0.4 | 0.4 | 0.3 | 0.3 | 0.3 | 0.4 | 0.4 | 0.4 | ||
| Previous years | |||||||||||||||||||
| All previous years | 0.4 | 0.3 | 0.3 | 0.4 | 0.4 | 0.3 | 0.4 | 0.5 | 0.3 | 0.4 | 0.4 | 0.3 | 0.3 | 0.3 | 0.4 | 0.4 | 0.4 | ||
| Previous 30 years | 0.4 | 0.3 | 0.3 | 0.4 | 0.4 | 0.3 | 0.4 | 0.5 | 0.3 | 0.4 | 0.4 | 0.3 | 0.3 | 0.3 | 0.4 | 0.4 | 0.4 | ||
| Previous 20 years | 0.3 | 0.3 | 0.2 | 0.3 | 0.4 | 0.3 | 0.4 | 0.5 | 0.3 | 0.4 | 0.4 | 0.2 | 0.3 | 0.3 | 0.4 | 0.4 | 0.3 | ||
| 10 year groups | |||||||||||||||||||
| [2007,2017) | 0.4 | 0.4 | 0.3 | 0.4 | 0.4 | 0.4 | 0.4 | 0.5 | 0.3 | 0.5 | 0.5 | 0.3 | 0.3 | 0.4 | 0.4 | 0.4 | 0.4 | ||
| [1997,2007) | 0.3 | 0.2 | 0.2 | 0.2 | 0.2 | 0.2 | 0.3 | 0.3 | 0.2 | 0.2 | 0.4 | 0.1 | 0.2 | 0.2 | 0.2 | 0.2 | 0.2 | ||
| [1987,1997) | 0.8 | 0.5 | 0.3 | 0.5 | 0.4 | 0.5 | 0.4 | 0.7 | 0.6 | 0.6 | 0.5 | 0.5 | 0.6 | 0.4 | 0.5 | 0.6 | 0.5 | ||
| 5 year groups | |||||||||||||||||||
| [2012,2017) | 0.3 | 0.4 | 0.3 | 0.4 | 0.5 | 0.4 | 0.5 | 0.6 | 0.4 | 0.5 | 0.5 | 0.3 | 0.3 | 0.4 | 0.5 | 0.5 | 0.4 | ||
| [2007,2012) | 0.5 | 0.2 | 0.2 | 0.3 | 0.3 | 0.2 | 0.3 | 0.1 | 0.1 | 0.4 | 0.2 | 0.2 | 0.3 | 0.2 | 0.2 | 0.3 | 0.3 | ||
| [2002,2007) | 0.3 | 0.1 | 0.1 | 0.2 | 0.2 | 0.1 | 0.3 | 0.3 | 0.1 | 0.1 | 0.4 | 0.1 | 0.2 | 0.2 | 0.2 | 0.2 | 0.2 | ||
| [1997,2002) | 0.3 | 0.3 | 0.3 | 0.3 | 0.2 | 0.3 | 0.4 | 0.3 | 0.4 | 0.3 | 0.3 | 0.2 | 0.2 | 0.2 | 0.3 | 0.3 | 0.3 | ||
| [1992,1997) | 1.6 | 0.5 | 0.3 | 0.5 | 0.6 | 0.5 | 0.4 | 0.7 | 0.7 | 0.5 | 0.5 | 0.5 | 0.8 | 0.5 | 0.5 | 0.5 | 0.6 | ||
| [1987,1992) | 0.4 | 0.4 | 0.4 | 0.5 | 0.3 | 0.4 | 0.4 | 0.7 | 0.5 | 0.7 | 0.5 | 0.5 | 0.5 | 0.4 | 0.5 | 0.6 | 0.5 | ||
| Year | |||||||||||||||||||
| 2017 | 0.4 | 0.4 | 0.3 | 0.4 | 0.4 | 0.5 | 0.7 | 0.6 | 0.2 | 0.5 | 0.4 | 0.4 | 0.4 | 0.4 | 0.6 | 0.4 | 0.4 | ||
| 2016 | 0.3 | 0.5 | 0.5 | 0.5 | 0.8 | 0.7 | 0.8 | 0.8 | 0.5 | 0.7 | 0.4 | 0.3 | 0.4 | 0.6 | 0.8 | 0.6 | 0.6 | ||
| 2015 | 0.5 | 0.6 | 0.4 | 0.5 | 0.5 | 0.6 | 0.4 | 0.6 | 0.3 | 0.2 | 0.4 | 0.3 | 0.4 | 0.5 | 0.5 | 0.3 | 0.4 | ||
| 2014 | 0.2 | 0.2 | 0.2 | 0.4 | 0.5 | 0.3 | 0.4 | 0.6 | 0.7 | 1.1 | 0.8 | 0.4 | 0.3 | 0.4 | 0.4 | 0.8 | 0.5 | ||
| 2013 | 0.1 | 0.1 | 0.2 | 0.3 | 0.3 | 0.1 | 0.1 | 0.3 | 0.2 | 0.1 | 1.2 | 0.4 | 0.3 | 0.3 | 0.2 | 0.4 | 0.3 | ||
| 2012 | 0.3 | 0.1 | 0.1 | 0.3 | 0.2 | 0.2 | 0.2 | 0.3 | 0.1 | 0.3 | 0.5 | 0.1 | 0.2 | 0.2 | 0.2 | 0.3 | 0.2 | ||
| 2011 | 0.5 | 0.3 | 0.3 | 0.3 | 0.2 | 0.3 | 0.3 | 0.1 | 0.2 | 1.1 | 0.1 | 0.4 | 0.4 | 0.3 | 0.2 | 0.5 | 0.3 | ||
| 2010 | 0.4 | 0.3 | 0.2 | 0.2 | 0.4 | 0.3 | 0.3 | 0.3 | 0.1 | 0.2 | 0.3 | 0.0 | 0.2 | 0.2 | 0.3 | 0.2 | 0.2 | ||
| 2009 | 0.2 | 0.3 | 0.1 | 0.3 | 0.1 | 0.1 | 0.5 | 0.0 | 0.1 | 0.3 | 0.3 | 0.0 | 0.1 | 0.2 | 0.2 | 0.2 | 0.2 | ||
| 2008 | 0.1 | 0.2 | 0.2 | 0.2 | 0.3 | 0.3 | 0.5 | 0.2 | 0.3 | 0.1 | 0.6 | 0.6 | 0.3 | 0.2 | 0.3 | 0.2 | 0.2 | ||
| 2007 | 1.5 | 0.0 | 0.1 | 0.2 | 0.3 | 0.2 | 0.1 | 0.0 | 0.0 | 0.2 | 0.2 | 0.1 | 0.3 | 0.2 | 0.2 | 0.1 | 0.2 | ||
| 2006 | 0.2 | 0.2 | 0.1 | 0.3 | 0.1 | 0.1 | 0.4 | 0.1 | 0.1 | 0.1 | 0.2 | 0.1 | 0.1 | 0.2 | 0.2 | 0.1 | 0.2 | ||
| 2005 | 0.1 | 0.1 | 0.0 | 0.1 | 0.3 | 0.1 | 0.3 | 0.1 | 0.3 | 0.1 | 0.6 | 0.1 | 0.1 | 0.1 | 0.1 | 0.3 | 0.2 | ||
| 2004 | 0.2 | 0.3 | 0.0 | 0.3 | 0.1 | 0.1 | 0.3 | 0.9 | 0.0 | 0.0 | 0.0 | 0.0 | 0.1 | 0.1 | 0.3 | 0.0 | 0.2 | ||
| 2003 | 0.2 | 0.1 | 0.1 | 0.1 | 0.1 | 0.1 | 0.1 | 0.4 | 0.1 | 0.1 | 0.0 | 0.0 | 0.1 | 0.1 | 0.2 | 0.1 | 0.1 | ||
| 2002 | 0.7 | 0.1 | 0.1 | 0.3 | 0.3 | 0.1 | 0.2 | 0.1 | 0.0 | 0.2 | 1.5 | 0.0 | 0.3 | 0.3 | 0.1 | 0.4 | 0.2 | ||
| 2001 | 0.1 | 0.3 | 0.4 | 0.3 | 0.2 | 0.4 | 0.4 | 0.2 | 0.5 | 0.7 | 0.1 | 0.1 | 0.2 | 0.3 | 0.3 | 0.5 | 0.3 | ||
| 2000 | 0.8 | 0.5 | 0.3 | 0.4 | 0.3 | 0.2 | 0.5 | 0.4 | 0.4 | 0.2 | 0.4 | 0.3 | 0.5 | 0.3 | 0.4 | 0.3 | 0.4 | ||
| 1999 | 0.0 | 0.1 | 0.0 | 0.2 | 0.1 | 0.2 | 0.2 | 0.1 | 0.3 | 0.2 | 0.2 | 0.1 | 0.1 | 0.1 | 0.2 | 0.2 | 0.2 | ||
| 1998 | 0.1 | 0.1 | 0.2 | 0.0 | 0.0 | 0.4 | 0.2 | 0.0 | 0.1 | 0.0 | 0.4 | 0.0 | 0.1 | 0.1 | 0.2 | 0.2 | 0.1 | ||
| 1997 | 0.1 | 0.1 | 0.1 | 0.1 | 0.2 | 0.1 | 0.2 | 0.4 | 0.1 | 0.0 | 0.6 | 0.0 | 0.1 | 0.1 | 0.2 | 0.2 | 0.2 | ||
| 1996 | 1.9 | 0.0 | 0.1 | 0.2 | 0.0 | 0.2 | 0.2 | 0.3 | 0.2 | 0.3 | 0.6 | 0.5 | 0.7 | 0.1 | 0.2 | 0.3 | 0.3 | ||
| 1995 | 0.9 | 0.1 | 0.1 | 0.3 | 0.1 | 0.3 | 0.4 | 0.3 | 0.7 | 0.1 | 0.2 | 0.1 | 0.3 | 0.2 | 0.4 | 0.3 | 0.3 | ||
| 1994 | 1.1 | 2.0 | 0.7 | 0.9 | 1.2 | 0.1 | 0.2 | 0.1 | 0.3 | 0.2 | 0.2 | 0.0 | 1.0 | 1.0 | 0.1 | 0.2 | 0.6 | ||
| 1993 | 2.2 | 0.6 | 0.2 | 0.5 | 1.3 | 1.2 | 0.4 | 3.8 | 0.7 | 0.3 | 0.3 | 0.4 | 0.9 | 0.7 | 1.6 | 0.4 | 0.8 | ||
| 1992 | 2.3 | 0.1 | 0.4 | 0.7 | 0.6 | 1.2 | 0.6 | 0.7 | 1.7 | 2.2 | 1.1 | 1.6 | 1.4 | 0.5 | 0.8 | 1.6 | 1.1 | ||
| 1991 | 1.0 | 1.1 | 0.7 | 1.8 | 1.2 | 0.8 | 1.4 | 2.3 | 1.0 | 3.7 | 2.0 | 0.8 | 1.0 | 1.3 | 1.4 | 2.2 | 1.4 | ||
| 1990 | 0.2 | 0.5 | 0.2 | 0.4 | 0.1 | 0.4 | 0.3 | 0.3 | 1.8 | 0.9 | 0.8 | 1.2 | 0.5 | 0.2 | 0.3 | 1.2 | 0.5 | ||
| 1989 | 0.2 | 0.3 | 0.3 | 0.4 | 0.2 | 0.4 | 0.3 | 1.0 | 0.2 | 0.7 | 0.2 | 0.5 | 0.3 | 0.3 | 0.5 | 0.4 | 0.4 | ||
| 1988 | 0.3 | 0.3 | 0.4 | 0.4 | 0.3 | 0.3 | 0.3 | 0.4 | 0.2 | 0.3 | 0.3 | 0.3 | 0.3 | 0.3 | 0.3 | 0.3 | 0.3 | ||
| 1987 | 1.5 | 0.4 | 0.4 | 0.4 | 0.3 | 0.5 | 0.4 | 0.3 | 0.4 | 0.3 | 0.3 | 0.5 | 0.5 | 0.4 | 0.4 | 0.3 | 0.4 | ||
| 1986 | 0.0 | 0.1 | 0.1 | 0.2 | 0.1 | 0.2 | 0.1 | 0.2 | 0.1 | 0.1 | 0.1 | 1.5 | 0.5 | 0.1 | 0.2 | 0.1 | 0.2 | ||
| 1985 | 0.0 | 0.4 | 0.0 | 0.2 | 0.0 | 0.1 | 0.1 | 1.4 | 0.0 | 1.5 | 0.1 | 0.2 | 0.2 | 0.1 | 0.4 | 0.8 | 0.3 | ||
| 1984 | 0.0 | 0.0 | 0.0 | 0.0 | 0.0 | 0.0 | 0.0 | 0.0 | 0.0 | 0.1 | 0.0 | 0.0 | 0.0 | 0.0 | 0.0 | 0.0 | 0.0 | ||
| 1983 | 0.0 | 0.0 | 0.0 | 0.0 | 0.0 | 0.0 | 0.0 | 0.0 | 0.0 | - | 0.0 | 0.0 | 0.0 | 0.0 | 0.0 | 0.0 | 0.0 | ||
| 1982 | - | 0.0 | - | 0.0 | 0.0 | 0.0 | - | 0.0 | - | 0.0 | - | 0.0 | 0.0 | 0.0 | 0.0 | 0.0 | 0.0 | ||
Reporting rates
Reporting rate is the proportion of all surveys in which the species was present.
Reporting rate by year
This chart shows the reporting rate of House Sparrow each year between 1982 and 2017. 
Reporting rate by month
This chart shows the reporting rate by month of House Sparrow. The blue lines show the reporting rate for the twelve months to June 2017 and the bars show the average reporting rate for the period 1982 to 2017. 
Reporting rate by season
This chart shows the seasonal reporting rate of House Sparrow. The blue lines show the seasonal reporting rate for the twelve months to June 2017 and the bars show the average seasonal reporting rate for the period 1982 to 2017. 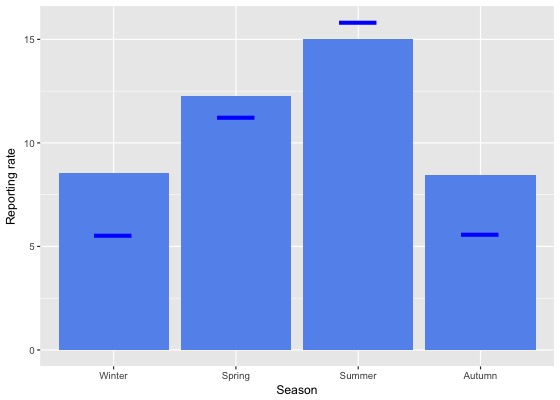
Reporting rate data
| Month | Season | ||||||||||||||||||
|---|---|---|---|---|---|---|---|---|---|---|---|---|---|---|---|---|---|---|---|
| Period | Jul | Aug | Sep | Oct | Nov | Dec | Jan | Feb | Mar | Apr | May | Jun | Winter | Spring | Summer | Autumn | All | ||
| All years | |||||||||||||||||||
| All | 8.6 | 11.3 | 10.9 | 12.0 | 14.2 | 14.1 | 17.4 | 13.2 | 6.8 | 8.9 | 10.1 | 6.5 | 8.5 | 12.3 | 15.0 | 8.4 | 11.3 | ||
| Previous years | |||||||||||||||||||
| All previous years | 8.9 | 12.2 | 11.2 | 12.1 | 14.2 | 13.9 | 17.3 | 13.0 | 7.3 | 9.2 | 11.1 | 6.9 | 9.1 | 12.4 | 14.9 | 9.0 | 11.5 | ||
| Previous 30 years | 9.0 | 12.3 | 11.3 | 12.2 | 14.4 | 14.1 | 17.4 | 13.1 | 7.3 | 9.1 | 11.1 | 7.0 | 9.2 | 12.5 | 15.0 | 8.9 | 11.6 | ||
| Previous 20 years | 6.6 | 10.5 | 8.9 | 10.4 | 12.7 | 12.2 | 16.7 | 11.3 | 5.4 | 7.3 | 8.9 | 4.8 | 6.9 | 10.5 | 13.6 | 6.9 | 9.7 | ||
| 10 year groups | |||||||||||||||||||
| [2007,2017) | 6.2 | 11.0 | 10.0 | 10.5 | 15.1 | 14.2 | 17.8 | 12.4 | 5.7 | 7.6 | 8.7 | 4.7 | 6.9 | 11.4 | 15.1 | 7.2 | 10.5 | ||
| [1997,2007) | 7.5 | 9.2 | 6.9 | 10.2 | 7.9 | 8.4 | 13.3 | 8.3 | 4.7 | 6.3 | 9.4 | 5.0 | 6.9 | 8.3 | 9.8 | 6.4 | 7.9 | ||
| [1987,1997) | 17.2 | 17.8 | 23.2 | 22.6 | 20.0 | 24.6 | 21.3 | 21.8 | 18.1 | 18.8 | 19.3 | 18.3 | 17.8 | 21.9 | 22.6 | 18.7 | 20.3 | ||
| 5 year groups | |||||||||||||||||||
| [2012,2017) | 6.9 | 12.0 | 11.9 | 12.6 | 17.0 | 16.5 | 18.2 | 12.5 | 6.2 | 8.3 | 7.8 | 5.0 | 7.8 | 13.5 | 16.0 | 7.4 | 11.6 | ||
| [2007,2012) | 4.2 | 7.5 | 5.5 | 6.8 | 9.8 | 9.2 | 16.2 | 11.9 | 4.4 | 6.1 | 11.3 | 4.0 | 4.8 | 7.0 | 12.3 | 6.6 | 7.7 | ||
| [2002,2007) | 7.0 | 6.9 | 5.1 | 9.7 | 6.8 | 7.0 | 13.2 | 7.4 | 4.5 | 4.0 | 7.9 | 4.0 | 5.7 | 7.2 | 8.9 | 5.1 | 6.8 | ||
| [1997,2002) | 8.3 | 12.0 | 9.0 | 11.1 | 9.3 | 10.4 | 13.3 | 9.2 | 5.0 | 9.2 | 11.3 | 6.4 | 8.6 | 9.7 | 10.9 | 8.0 | 9.4 | ||
| [1992,1997) | 7.4 | 6.2 | 7.6 | 7.7 | 10.4 | 12.0 | 6.9 | 9.3 | 6.8 | 5.9 | 7.1 | 4.8 | 6.1 | 8.6 | 9.3 | 6.6 | 7.6 | ||
| [1987,1992) | 21.6 | 24.1 | 30.6 | 30.7 | 24.7 | 30.1 | 29.2 | 26.6 | 24.8 | 26.2 | 25.7 | 26.0 | 23.9 | 28.5 | 28.6 | 25.6 | 26.8 | ||
| Year | |||||||||||||||||||
| 2017 | 6.3 | 6.9 | 8.7 | 11.1 | 13.9 | 15.1 | 17.8 | 14.2 | 4.0 | 7.2 | 5.8 | 4.2 | 5.6 | 11.2 | 15.8 | 5.6 | 9.8 | ||
| 2016 | 5.6 | 11.5 | 12.5 | 13.6 | 18.8 | 16.8 | 18.6 | 12.0 | 6.3 | 8.5 | 6.5 | 5.1 | 7.6 | 14.6 | 15.8 | 7.2 | 11.5 | ||
| 2015 | 7.7 | 16.1 | 13.0 | 14.2 | 16.1 | 17.1 | 13.6 | 13.0 | 4.9 | 4.3 | 8.2 | 4.6 | 8.6 | 14.3 | 14.5 | 5.6 | 11.1 | ||
| 2014 | 4.8 | 7.6 | 9.6 | 10.4 | 13.3 | 12.7 | 15.9 | 10.6 | 8.9 | 15.3 | 10.7 | 8.1 | 7.3 | 10.8 | 13.7 | 11.5 | 11.2 | ||
| 2013 | 3.2 | 5.9 | 7.9 | 6.5 | 12.3 | 19.1 | 27.7 | 17.0 | 6.5 | 10.0 | 9.6 | 5.1 | 4.7 | 8.5 | 21.7 | 8.4 | 11.9 | ||
| 2012 | 13.0 | 15.7 | 14.9 | 16.1 | 22.4 | 13.2 | 18.9 | 10.2 | 3.9 | 6.3 | 6.4 | 2.4 | 9.7 | 17.3 | 15.4 | 5.4 | 12.9 | ||
| 2011 | 5.7 | 9.6 | 8.5 | 9.1 | 6.1 | 16.4 | 24.3 | 23.7 | 10.3 | 12.2 | 17.1 | 9.9 | 9.0 | 8.4 | 21.2 | 13.0 | 13.2 | ||
| 2010 | 6.2 | 7.9 | 6.7 | 6.5 | 10.5 | 8.7 | 17.4 | 11.8 | 2.8 | 4.3 | 8.8 | 1.5 | 4.0 | 7.5 | 12.3 | 4.4 | 7.2 | ||
| 2009 | 2.2 | 13.5 | 5.6 | 5.7 | 7.1 | 3.7 | 13.3 | 1.7 | 1.9 | 3.7 | 6.1 | 0.9 | 3.9 | 6.0 | 6.3 | 3.6 | 5.1 | ||
| 2008 | 1.4 | 5.2 | 3.4 | 5.5 | 10.7 | 8.6 | 11.9 | 8.3 | 2.7 | 1.9 | 6.3 | 3.3 | 3.2 | 5.7 | 9.4 | 2.9 | 5.2 | ||
| 2007 | 7.7 | 1.9 | 3.3 | 7.7 | 16.2 | 5.7 | 8.3 | 3.5 | 1.7 | 7.7 | 10.6 | 2.3 | 3.2 | 7.9 | 6.3 | 5.9 | 6.1 | ||
| 2006 | 5.3 | 3.9 | 3.5 | 7.9 | 4.8 | 4.5 | 17.4 | 7.4 | 5.0 | 4.3 | 7.2 | 5.0 | 4.8 | 6.0 | 10.0 | 5.3 | 6.3 | ||
| 2005 | 2.9 | 5.6 | 4.1 | 5.5 | 7.6 | 4.4 | 11.3 | 5.4 | 5.6 | 4.4 | 9.0 | 3.1 | 3.6 | 5.4 | 6.6 | 6.3 | 5.5 | ||
| 2004 | 6.3 | 6.6 | 2.4 | 9.3 | 4.7 | 6.9 | 6.1 | 8.1 | 1.6 | 0.5 | 1.9 | 2.5 | 5.3 | 5.3 | 6.9 | 1.3 | 4.7 | ||
| 2003 | 5.1 | 7.9 | 5.9 | 9.3 | 7.3 | 8.9 | 12.6 | 8.8 | 4.0 | 5.1 | 7.8 | 3.1 | 5.3 | 7.4 | 9.8 | 5.3 | 7.0 | ||
| 2002 | 13.7 | 10.2 | 10.0 | 16.3 | 9.0 | 8.8 | 18.2 | 6.6 | 5.5 | 5.4 | 14.1 | 5.9 | 9.8 | 12.0 | 10.6 | 7.0 | 10.1 | ||
| 2001 | 6.2 | 13.3 | 12.2 | 13.9 | 15.9 | 14.9 | 15.5 | 10.8 | 4.2 | 14.6 | 6.9 | 4.4 | 7.6 | 13.6 | 13.9 | 7.9 | 10.9 | ||
| 2000 | 18.3 | 22.2 | 13.5 | 15.4 | 13.9 | 11.4 | 17.8 | 11.0 | 5.3 | 10.6 | 14.5 | 8.6 | 15.7 | 14.3 | 13.3 | 9.1 | 13.0 | ||
| 1999 | 5.9 | 3.1 | 2.9 | 8.2 | 4.5 | 9.4 | 8.8 | 7.9 | 6.5 | 6.7 | 14.8 | 9.3 | 7.2 | 5.1 | 8.7 | 9.2 | 7.6 | ||
| 1998 | 2.7 | 5.7 | 4.9 | 1.1 | 1.8 | 3.8 | 5.9 | 0.0 | 3.2 | 2.6 | 7.4 | 4.0 | 4.2 | 2.7 | 3.5 | 3.8 | 3.4 | ||
| 1997 | 2.3 | 1.7 | 4.5 | 7.9 | 4.3 | 3.8 | 5.9 | 8.8 | 7.5 | 2.8 | 8.9 | 0.0 | 1.4 | 5.3 | 5.7 | 5.2 | 4.4 | ||
| 1996 | 6.0 | 1.1 | 5.3 | 5.3 | 3.7 | 8.1 | 2.9 | 4.7 | 2.0 | 7.8 | 12.1 | 5.7 | 4.0 | 4.7 | 5.2 | 6.2 | 5.0 | ||
| 1995 | 4.3 | 2.3 | 2.9 | 7.3 | 3.6 | 6.9 | 6.2 | 9.5 | 8.2 | 4.8 | 5.2 | 2.1 | 2.8 | 5.0 | 7.2 | 6.0 | 5.2 | ||
| 1994 | 11.8 | 15.6 | 20.6 | 9.3 | 19.9 | 6.5 | 11.8 | 5.2 | 4.5 | 4.6 | 5.0 | 2.2 | 9.2 | 16.9 | 8.1 | 4.7 | 9.9 | ||
| 1993 | 6.1 | 10.3 | 4.8 | 6.7 | 13.6 | 23.9 | 6.1 | 21.9 | 11.1 | 5.0 | 6.5 | 4.3 | 7.1 | 8.4 | 16.5 | 7.8 | 9.3 | ||
| 1992 | 10.8 | 5.6 | 7.1 | 10.6 | 9.7 | 20.6 | 10.3 | 14.6 | 9.9 | 10.2 | 7.9 | 11.7 | 9.5 | 9.2 | 15.4 | 9.2 | 10.5 | ||
| 1991 | 7.1 | 7.4 | 8.1 | 10.7 | 12.4 | 12.2 | 10.7 | 26.0 | 11.1 | 10.2 | 9.8 | 8.0 | 7.4 | 10.5 | 15.6 | 10.4 | 10.5 | ||
| 1990 | 20.0 | 17.3 | 16.1 | 20.4 | 11.2 | 25.0 | 23.6 | 18.3 | 17.0 | 15.5 | 13.7 | 19.7 | 18.8 | 15.8 | 22.3 | 15.5 | 18.0 | ||
| 1989 | 23.0 | 30.6 | 26.6 | 31.9 | 25.8 | 24.3 | 28.2 | 24.7 | 20.0 | 27.2 | 21.7 | 29.8 | 27.9 | 28.4 | 25.7 | 23.1 | 26.4 | ||
| 1988 | 29.3 | 28.4 | 42.1 | 30.9 | 26.6 | 33.3 | 27.6 | 28.6 | 25.2 | 31.6 | 30.8 | 26.1 | 28.0 | 32.0 | 29.9 | 29.1 | 29.8 | ||
| 1987 | 27.3 | 33.3 | 39.3 | 41.4 | 30.1 | 41.2 | 39.0 | 29.2 | 35.9 | 28.8 | 31.9 | 29.4 | 29.6 | 36.3 | 36.1 | 32.0 | 34.4 | ||
| 1986 | 11.5 | 10.5 | 11.3 | 19.4 | 14.9 | 14.7 | 13.0 | 11.1 | 19.4 | 13.7 | 17.2 | 5.7 | 9.1 | 14.7 | 12.9 | 16.2 | 13.4 | ||
| 1985 | 0.0 | 6.7 | 1.9 | 3.5 | 1.8 | 3.3 | 12.5 | 29.4 | 9.1 | 26.3 | 20.0 | 3.6 | 3.4 | 2.6 | 9.4 | 20.0 | 5.9 | ||
| 1984 | 0.0 | 0.0 | 0.0 | 0.0 | 0.0 | 0.0 | 0.0 | 0.0 | 3.7 | 5.9 | 0.0 | 0.0 | 0.0 | 0.0 | 0.0 | 3.3 | 1.3 | ||
| 1983 | 0.0 | 0.0 | 0.0 | 0.0 | 0.0 | 0.0 | 0.0 | 0.0 | 0.0 | - | 0.0 | 0.0 | 0.0 | 0.0 | 0.0 | 0.0 | 0.0 | ||
| 1982 | - | 0.0 | - | 0.0 | 0.0 | 0.0 | - | 0.0 | - | 0.0 | - | 0.0 | 0.0 | 0.0 | 0.0 | 0.0 | 0.0 | ||
Breeding data
Breeding records by month
Number of breeding records by breeding code and month, 2017 and all years| Breeding code | Jul | Aug | Sep | Oct | Nov | Dec | Jan | Feb | Mar | Apr | May | Jun |
|---|---|---|---|---|---|---|---|---|---|---|---|---|
| 2017 | ||||||||||||
| Breeding (BLA code) | 0 | 0 | 0 | 0 | 0 | 1 | 0 | 0 | 0 | 0 | 0 | 0 |
| Carrying Food | 0 | 0 | 0 | 1 | 0 | 1 | 1 | 1 | 0 | 0 | 0 | 0 |
| Copulating | 0 | 0 | 0 | 0 | 0 | 0 | 0 | 0 | 0 | 0 | 0 | 0 |
| Display | 0 | 0 | 1 | 0 | 0 | 0 | 0 | 0 | 0 | 0 | 0 | 0 |
| Dependent young | 0 | 0 | 0 | 1 | 0 | 0 | 0 | 0 | 0 | 0 | 0 | 0 |
| Faecal sac | 0 | 0 | 0 | 0 | 0 | 0 | 0 | 0 | 0 | 0 | 0 | 0 |
| Inspecting hollow | 0 | 0 | 0 | 0 | 1 | 0 | 0 | 0 | 0 | 0 | 0 | 0 |
| Nest building | 0 | 0 | 0 | 1 | 2 | 2 | 1 | 0 | 0 | 0 | 0 | 0 |
| Nest with eggs | 0 | 0 | 0 | 0 | 0 | 0 | 0 | 0 | 0 | 0 | 0 | 0 |
| Nest with young | 0 | 0 | 0 | 0 | 0 | 1 | 0 | 0 | 0 | 0 | 0 | 0 |
| On/leaving nest | 0 | 0 | 0 | 0 | 0 | 0 | 0 | 0 | 0 | 0 | 0 | 0 |
| All years | ||||||||||||
| Breeding (BLA code) | 0 | 2 | 1 | 4 | 0 | 4 | 1 | 0 | 0 | 0 | 0 | 0 |
| Carrying Food | 0 | 0 | 0 | 5 | 7 | 7 | 5 | 1 | 0 | 0 | 0 | 0 |
| Copulating | 0 | 0 | 0 | 2 | 1 | 0 | 0 | 0 | 0 | 0 | 0 | 0 |
| Display | 0 | 0 | 1 | 0 | 0 | 0 | 0 | 0 | 0 | 0 | 0 | 0 |
| Dependent young | 0 | 0 | 0 | 8 | 12 | 9 | 6 | 7 | 2 | 0 | 0 | 0 |
| Faecal sac | 0 | 0 | 0 | 0 | 0 | 0 | 0 | 0 | 0 | 0 | 0 | 0 |
| Inspecting hollow | 0 | 0 | 3 | 3 | 4 | 3 | 0 | 0 | 0 | 0 | 0 | 0 |
| Nest building | 0 | 1 | 10 | 33 | 15 | 13 | 7 | 3 | 0 | 0 | 0 | 1 |
| Nest with eggs | 0 | 0 | 1 | 2 | 0 | 0 | 0 | 0 | 0 | 0 | 0 | 0 |
| Nest with young | 0 | 0 | 0 | 11 | 6 | 10 | 4 | 6 | 0 | 0 | 0 | 0 |
| On/leaving nest | 0 | 0 | 1 | 8 | 4 | 2 | 3 | 0 | 0 | 0 | 0 | 0 |
Breeding records by year
Average number of breeding records per period by breeding code| Period | Breeding (BLA code) | Carrying Food | Copulating | Display | Dependent young | Faecal sac | Inspecting hollow | Nest building | Nest with eggs | Nest with young | On/leaving nest |
|---|---|---|---|---|---|---|---|---|---|---|---|
| All years | |||||||||||
| All | 0.3 | 0.7 | 0.1 | 0.0 | 1.2 | 0.0 | 0.4 | 2.3 | 0.1 | 1.0 | 0.5 |
| Previous years | |||||||||||
| All previous years | 0.3 | 0.6 | 0.1 | 0.0 | 1.2 | 0.0 | 0.3 | 2.2 | 0.1 | 1.0 | 0.5 |
| Previous 30 years | 0.4 | 0.7 | 0.1 | 0.0 | 1.4 | 0.0 | 0.4 | 2.6 | 0.1 | 1.2 | 0.6 |
| Previous 20 years | 0.6 | 0.5 | 0.1 | 0.0 | 0.6 | 0.0 | 0.6 | 0.9 | 0.0 | 0.3 | 0.9 |
| 10 year groups | |||||||||||
| [2007,2017) | 0.3 | 0.9 | 0.2 | 0.0 | 0.8 | 0.0 | 0.8 | 1.1 | 0.0 | 0.4 | 1.7 |
| [1997,2007) | 0.8 | 0.1 | 0.1 | 0.0 | 0.4 | 0.0 | 0.4 | 0.8 | 0.0 | 0.2 | 0.1 |
| [1987,1997) | 0.0 | 1.1 | 0.0 | 0.0 | 3.0 | 0.0 | 0.0 | 5.8 | 0.3 | 3.0 | 0.0 |
| 5 year groups | |||||||||||
| [2012,2017) | 0.0 | 1.2 | 0.2 | 0.0 | 0.6 | 0.0 | 0.8 | 1.4 | 0.0 | 0.8 | 1.4 |
| [2007,2012) | 0.6 | 0.6 | 0.2 | 0.0 | 1.0 | 0.0 | 0.8 | 0.8 | 0.0 | 0.0 | 2.0 |
| [2002,2007) | 0.0 | 0.2 | 0.2 | 0.0 | 0.4 | 0.0 | 0.4 | 0.8 | 0.0 | 0.2 | 0.0 |
| [1997,2002) | 1.6 | 0.0 | 0.0 | 0.0 | 0.4 | 0.0 | 0.4 | 0.8 | 0.0 | 0.2 | 0.2 |
| [1992,1997) | 0.0 | 0.0 | 0.0 | 0.0 | 0.0 | 0.0 | 0.0 | 0.4 | 0.0 | 0.4 | 0.0 |
| [1987,1992) | 0.0 | 2.2 | 0.0 | 0.0 | 6.0 | 0.0 | 0.0 | 11.2 | 0.6 | 5.6 | 0.0 |
| Year | |||||||||||
| 2017 | 1.0 | 4.0 | 0.0 | 1.0 | 1.0 | 0.0 | 1.0 | 6.0 | 0.0 | 1.0 | 0.0 |
| 2016 | 0.0 | 4.0 | 0.0 | 0.0 | 0.0 | 0.0 | 1.0 | 4.0 | 0.0 | 1.0 | 2.0 |
| 2015 | 0.0 | 1.0 | 0.0 | 0.0 | 2.0 | 0.0 | 2.0 | 1.0 | 0.0 | 2.0 | 0.0 |
| 2014 | 0.0 | 1.0 | 0.0 | 0.0 | 0.0 | 0.0 | 1.0 | 1.0 | 0.0 | 1.0 | 3.0 |
| 2013 | 0.0 | 0.0 | 1.0 | 0.0 | 0.0 | 0.0 | 0.0 | 1.0 | 0.0 | 0.0 | 1.0 |
| 2012 | 0.0 | 0.0 | 0.0 | 0.0 | 1.0 | 0.0 | 0.0 | 0.0 | 0.0 | 0.0 | 1.0 |
| 2011 | 0.0 | 0.0 | 0.0 | 0.0 | 3.0 | 0.0 | 1.0 | 0.0 | 0.0 | 0.0 | 3.0 |
| 2010 | 0.0 | 1.0 | 0.0 | 0.0 | 1.0 | 0.0 | 0.0 | 2.0 | 0.0 | 0.0 | 3.0 |
| 2009 | 1.0 | 1.0 | 0.0 | 0.0 | 1.0 | 0.0 | 2.0 | 0.0 | 0.0 | 0.0 | 1.0 |
| 2008 | 1.0 | 1.0 | 0.0 | 0.0 | 0.0 | 0.0 | 0.0 | 1.0 | 0.0 | 0.0 | 3.0 |
| 2007 | 1.0 | 0.0 | 1.0 | 0.0 | 0.0 | 0.0 | 1.0 | 1.0 | 0.0 | 0.0 | 0.0 |
| 2006 | 0.0 | 0.0 | 0.0 | 0.0 | 0.0 | 0.0 | 1.0 | 1.0 | 0.0 | 1.0 | 0.0 |
| 2005 | 0.0 | 0.0 | 0.0 | 0.0 | 1.0 | 0.0 | 0.0 | 2.0 | 0.0 | 0.0 | 0.0 |
| 2004 | 0.0 | 0.0 | 0.0 | 0.0 | 1.0 | 0.0 | 0.0 | 0.0 | 0.0 | 0.0 | 0.0 |
| 2003 | 0.0 | 0.0 | 1.0 | 0.0 | 0.0 | 0.0 | 0.0 | 0.0 | 0.0 | 0.0 | 0.0 |
| 2002 | 0.0 | 1.0 | 0.0 | 0.0 | 0.0 | 0.0 | 1.0 | 1.0 | 0.0 | 0.0 | 0.0 |
| 2001 | 1.0 | 0.0 | 0.0 | 0.0 | 1.0 | 0.0 | 2.0 | 1.0 | 0.0 | 1.0 | 1.0 |
| 2000 | 6.0 | 0.0 | 0.0 | 0.0 | 1.0 | 0.0 | 0.0 | 2.0 | 0.0 | 0.0 | 0.0 |
| 1999 | 1.0 | 0.0 | 0.0 | 0.0 | 0.0 | 0.0 | 0.0 | 1.0 | 0.0 | 0.0 | 0.0 |
| 1998 | 0.0 | 0.0 | 0.0 | 0.0 | 0.0 | 0.0 | 0.0 | 0.0 | 0.0 | 0.0 | 0.0 |
| 1997 | 0.0 | 0.0 | 0.0 | 0.0 | 0.0 | 0.0 | 0.0 | 0.0 | 0.0 | 0.0 | 0.0 |
| 1996 | 0.0 | 0.0 | 0.0 | 0.0 | 0.0 | 0.0 | 0.0 | 0.0 | 0.0 | 0.0 | 0.0 |
| 1995 | 0.0 | 0.0 | 0.0 | 0.0 | 0.0 | 0.0 | 0.0 | 0.0 | 0.0 | 0.0 | 0.0 |
| 1994 | 0.0 | 0.0 | 0.0 | 0.0 | 0.0 | 0.0 | 0.0 | 0.0 | 0.0 | 0.0 | 0.0 |
| 1993 | 0.0 | 0.0 | 0.0 | 0.0 | 0.0 | 0.0 | 0.0 | 0.0 | 0.0 | 1.0 | 0.0 |
| 1992 | 0.0 | 0.0 | 0.0 | 0.0 | 0.0 | 0.0 | 0.0 | 2.0 | 0.0 | 1.0 | 0.0 |
| 1991 | 0.0 | 0.0 | 0.0 | 0.0 | 0.0 | 0.0 | 0.0 | 1.0 | 0.0 | 1.0 | 0.0 |
| 1990 | 0.0 | 0.0 | 0.0 | 0.0 | 1.0 | 0.0 | 0.0 | 1.0 | 0.0 | 1.0 | 0.0 |
| 1989 | 0.0 | 4.0 | 0.0 | 0.0 | 3.0 | 0.0 | 0.0 | 22.0 | 2.0 | 4.0 | 0.0 |
| 1988 | 0.0 | 3.0 | 0.0 | 0.0 | 12.0 | 0.0 | 0.0 | 9.0 | 1.0 | 4.0 | 0.0 |
| 1987 | 0.0 | 4.0 | 0.0 | 0.0 | 14.0 | 0.0 | 0.0 | 23.0 | 0.0 | 18.0 | 0.0 |
| 1986 | 0.0 | 0.0 | 0.0 | 0.0 | 1.0 | 0.0 | 0.0 | 0.0 | 0.0 | 0.0 | 0.0 |
| 1985 | 0.0 | 0.0 | 0.0 | 0.0 | 0.0 | 0.0 | 0.0 | 0.0 | 0.0 | 0.0 | 0.0 |
| 1984 | 0.0 | 0.0 | 0.0 | 0.0 | 0.0 | 0.0 | 0.0 | 0.0 | 0.0 | 0.0 | 0.0 |
| 1983 | 0.0 | 0.0 | 0.0 | 0.0 | 0.0 | 0.0 | 0.0 | 0.0 | 0.0 | 0.0 | 0.0 |
| 1982 | 0.0 | 0.0 | 0.0 | 0.0 | 0.0 | 0.0 | 0.0 | 0.0 | 0.0 | 0.0 | 0.0 |
Distribution map
Distribution - 2017
This map shows the observed distribution of the House Sparrow for 2017.
The red circles are the grid cells where House Sparrow have been reported.
The transparency of the red circles indicate how many surveys sheets were submitted for that grid cell; the darker the red the more reliable the data. Of the 315 grid cells with reports, 83 had only one sheet; an example is grid number F5.
The size of the circle represents the reporting rate. The maximum reporting rate for House Sparrow was 100.0% (eg grid number F5) and the minimum was 0.3% (eg grid number K14). 
Distribution - all years
This map shows the observed distribution of the House Sparrow for all years.
The red circles are the grid cells where House Sparrow have been reported.
The transparency of the red circles indicate how many surveys sheets were submitted for that grid cell; the darker the red the more reliable the data. Of the 703 grid cells with reports, 55 had only one sheet; an example is grid number S27.
The size of the circle represents the reporting rate. The maximum reporting rate for House Sparrow was 100.0% (eg grid number S27) and the minimum was 0.3% (eg grid number H25). 
Breeding map
Breeding - 2017
This map shows the breeding distribution of the House Sparrow for 2017.
The red circles are the grid cells where breeding activity for House Sparrow have been reported.
The size of the circle represents the number of reports. 
Breeding - all years
This map shows the breeding distribution of the House Sparrow for all years.
The red circles are the grid cells where breeding activity for House Sparrow have been reported.
The size of the circle represents the number of reports. 